Facebook Page Insights and Google Data Studio
Facebook Page Insights is part of Facebook's graph application programing interface, or Graph API for short, for the data associated with your Facebook page.
Facebook's description of the Pages Insights Api states:
"The Graph API is the primary way to get data into and out of the Facebook platform. It's a low-level HTTP-based API that apps can use to programmatically query data"
Using our Google Data Studio connector you can query the data associated with any Facebook page you have access to.
You can find out ages and genders of users along with a wide range of engagement metrics.
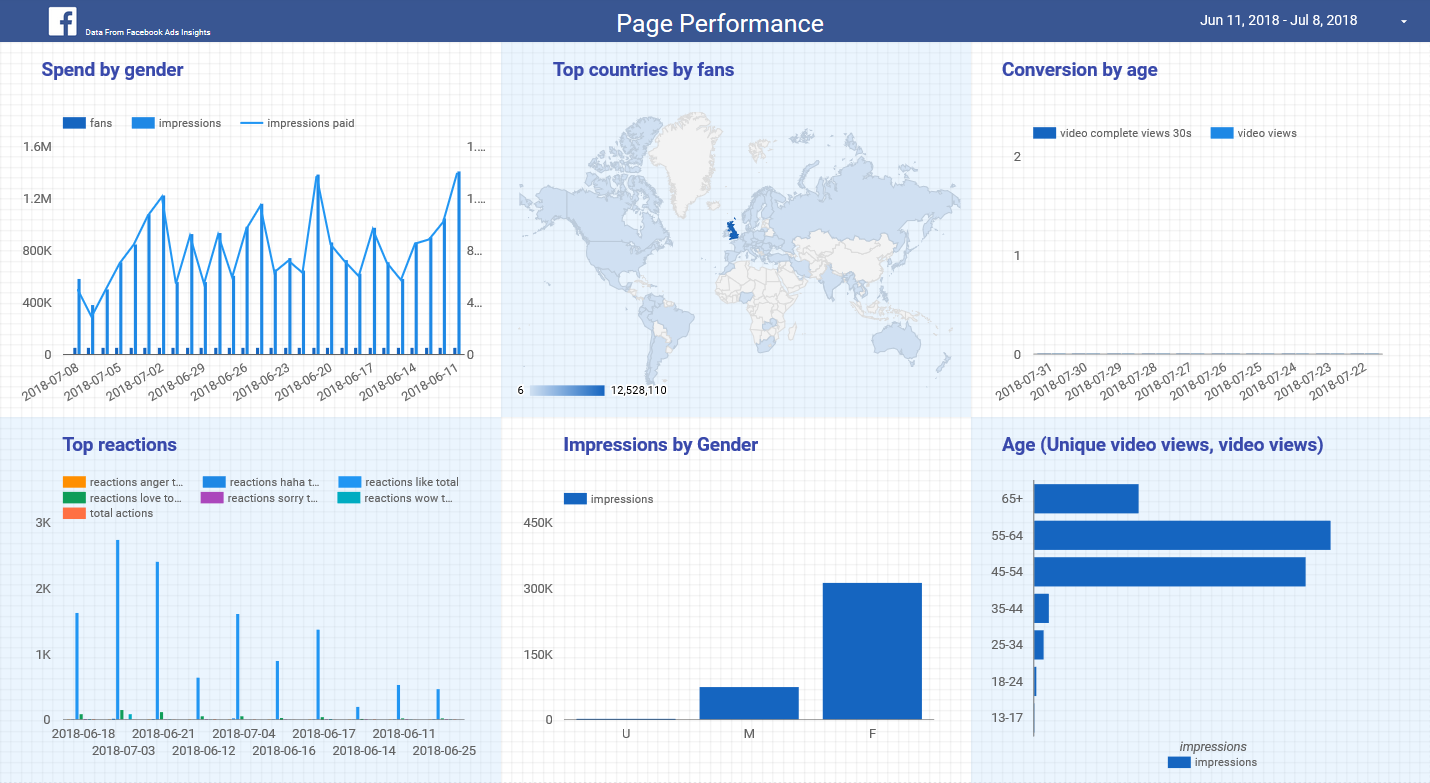
Here are some examples of important and interesting metrics that you can extract by combined Data Relate, Google Data Studio and FAcebook ads insights.
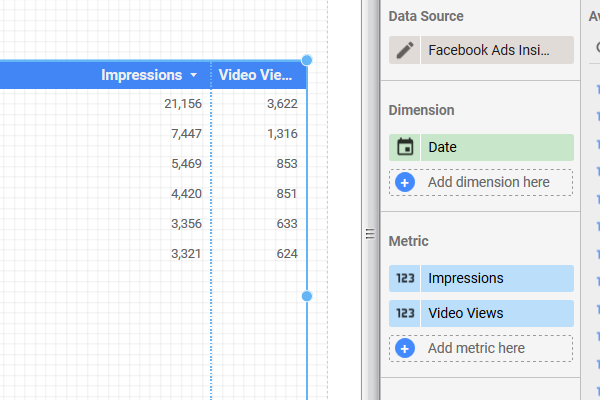
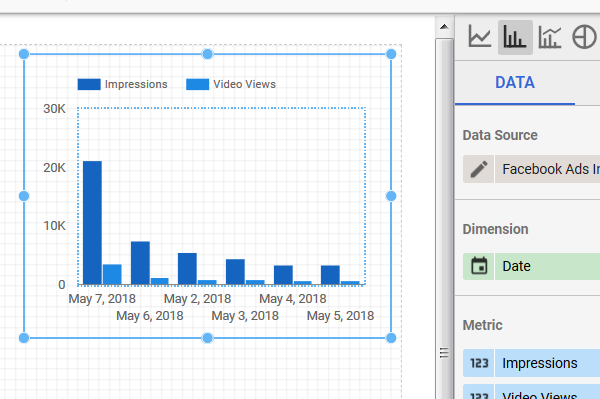
- page_impressions - "The number of times any content from your Page or about your Page entered a person's screen. This includes posts, check-ins, ads, social information from people who interact with your Page and more."
- page_consumptions - "The number of times people clicked on any of your content."
- page_video_views - "Total number of times page's videos have been viewed for more than 3 seconds."
Use Google Data Studio and Facebook Page Insights to monitor your organic page performance
Subscribers to our connector set get a free DataStudio template for the Facebook Page Insights apis.
Setting it up is as simple as copying our bespoke dashboard into your account.
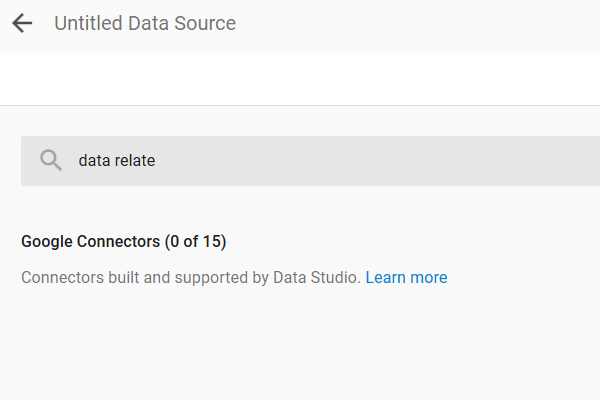
Guide To Using The Facebook Pages Insights Data Studio Connector
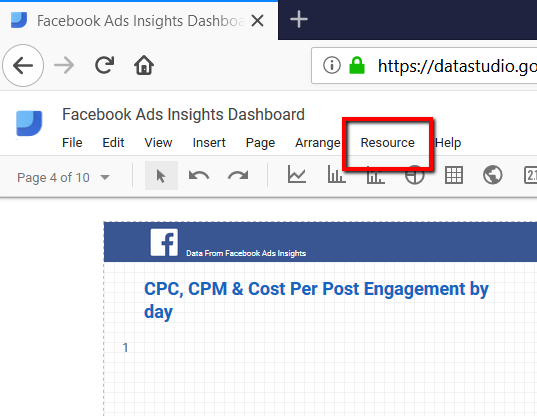
Step 1
After logging in and selecting a Data Studio dashboard, click on Resource in the top nav bar
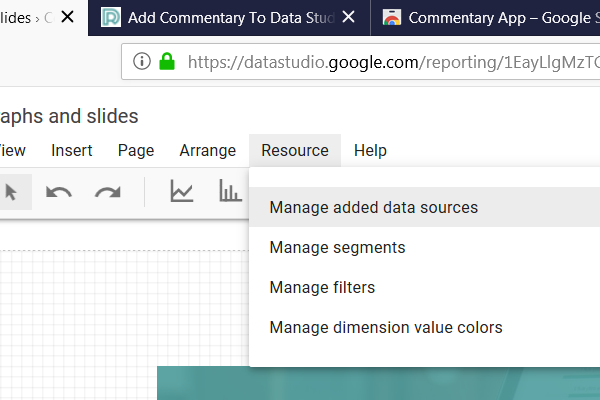
Step 2
Under resources select manage added data sources, which leads to the full list of add data sources.
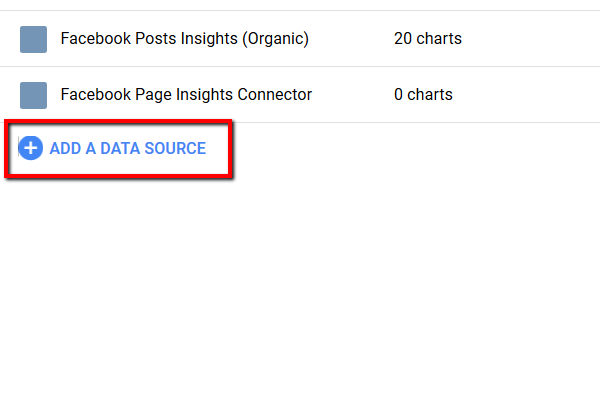
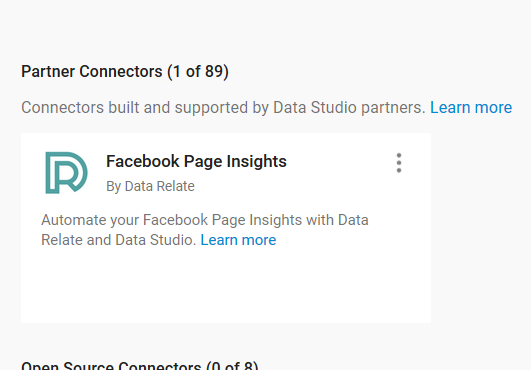
Step 3
At the bottom of your added resources there is a plus with add a data source next to it. Click to add the Data Relate Facebook Ads Connector.
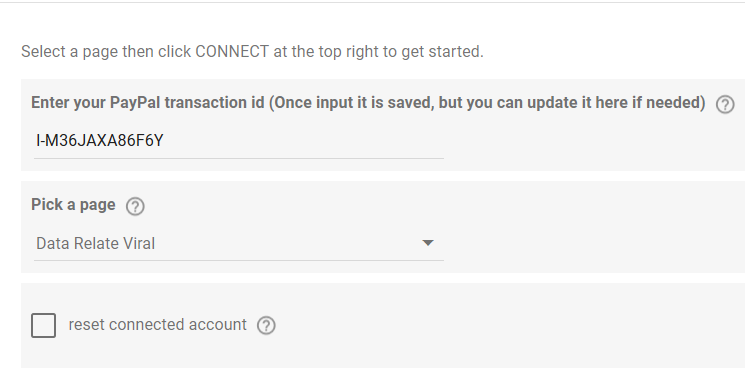
Step 7
Scroll down to find the settings for the app. You can get your PayPal ID from your account here. Pick the Facebook account you want to work with and the click/conversion window.
NB: The paypal will be associated with your Google email account. Only when logged in to this Google accoutn will you be able to sue the app.
Step 8
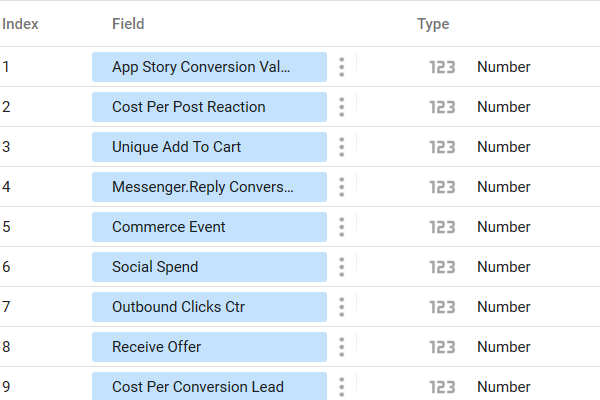
Once the configuration settings are selected you can see all metrics available with the connector
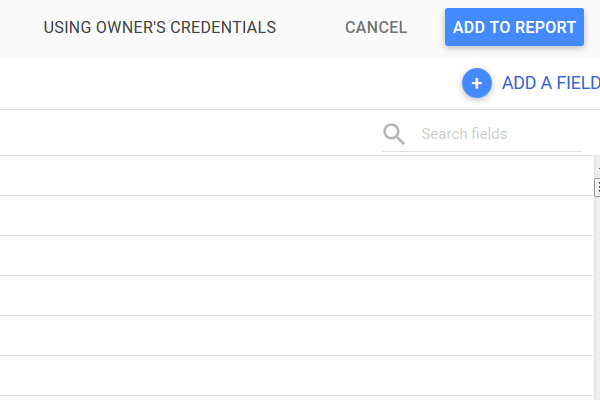
Step 9
Then click the "Add to report" button in the top right corner. If you are install in the app for the first time, you will see be able to use our free template at this stage.