Instagram Ads Insights and Google Data Studio
Facebook Ads Insights is an interface, API, for Facebook's advertising reporting and analytics.
Facebook's description of the Ads Insights Api states:
"Provides a single, consistent interface to retrieve statistics about Ads, Ad Sets, and Campaigns."
Using the our Google Sheets plugin, you can automate any combination of stats into a spreadsheet.
This can then be connected to Google Data Studio.
Here are some examples of important and interesting metrics that you can extract by combined Data Relate, Google Data Studio and FAcebook ads insights.
- Cost per action type - This covers the cost of all relevant actions and can be broken down into the relevant actions
- CPP - this is the cost per person reached, compared to the cpm which is the cost per impression, where someone could see it twice
- Relevance Score - Once your ad has received greater than 500 impressions it is given a rating from 1 to 10, based on how well your target audience is responding to your ad.
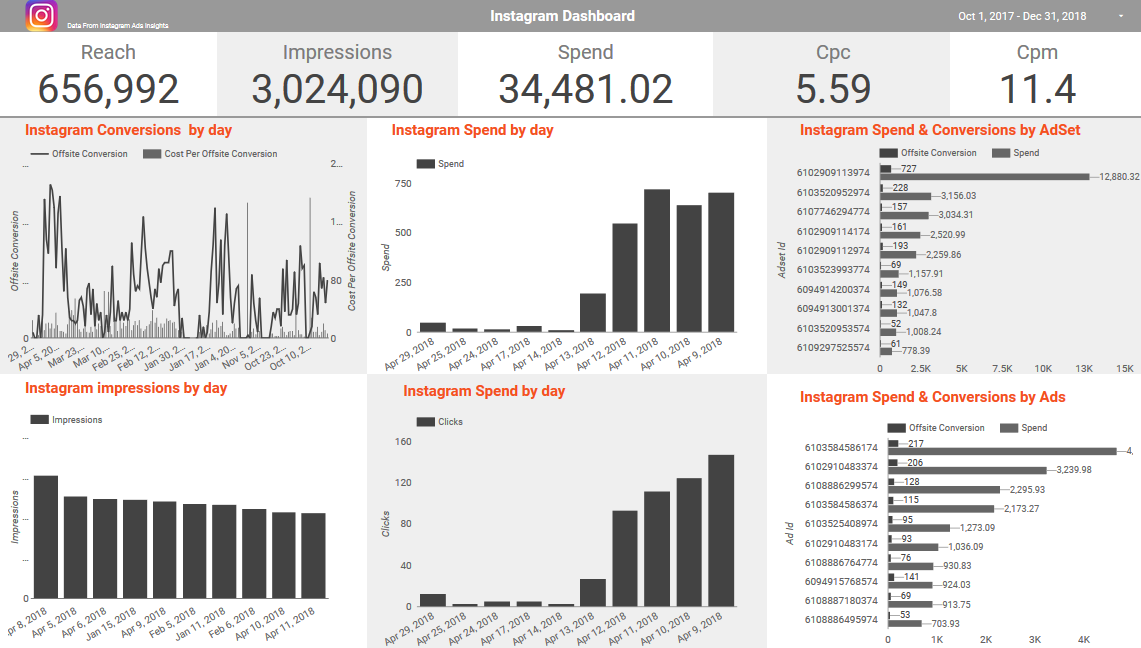
Use Google Data Studio and Instagram Ads Insights to monitor your campaigns
We provide free DataStudio templates to make setting up dashboards a simple as copying one into your account.
Once there you can link to a spreadsheet with Data Relate: FB installed and update with your own data.
If you invest in our product your dashboards can updated on a daily basis.
You could have a bespoke dashboard that compared cost per action with relevance score across all of your campaigns.
With Google Data Studio, you can brand the dashboards with your company logo and share with your clients.
Think of the time you could save.
Guide To Using The Instagram Ads Insights Data Studio Connector
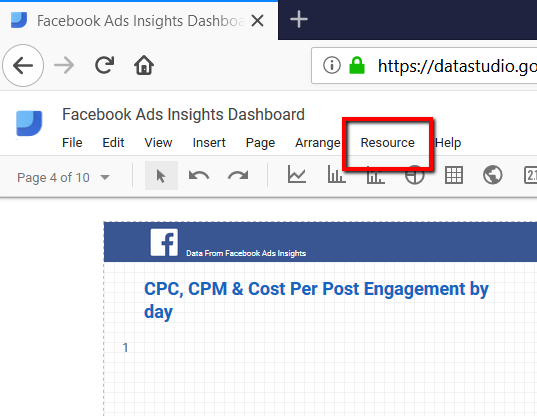
Step 1
After logging in and selecting a Data Studio dashboard, click on Resource in the top nav bar
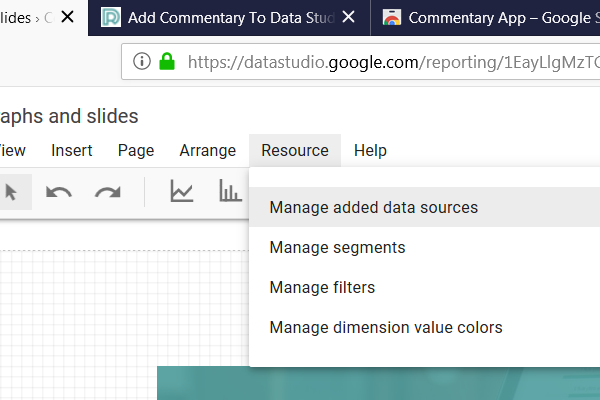
Step 2
Under resources select manage added data sources, which leads to the full list of add data sources.
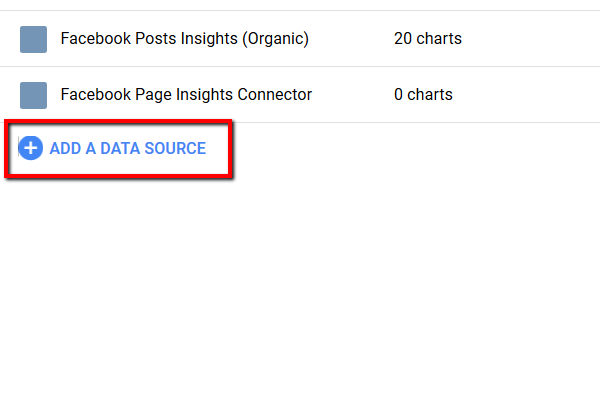
Step 3
At the bottom of your added resources there is a plus with add a data source next to it. Click to add the Data Relate Facebook Ads Connector.
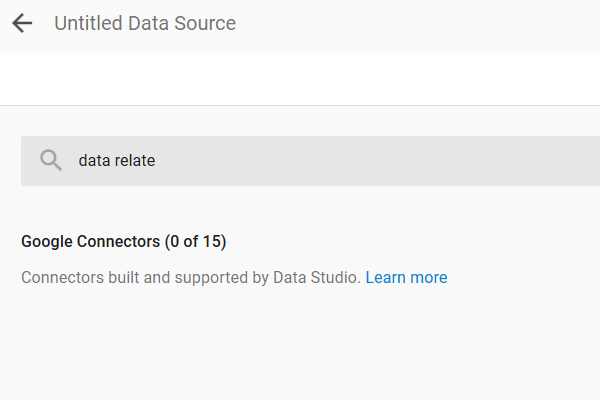
Step 4
Then search for "Data Relate" to find the connectors we've created
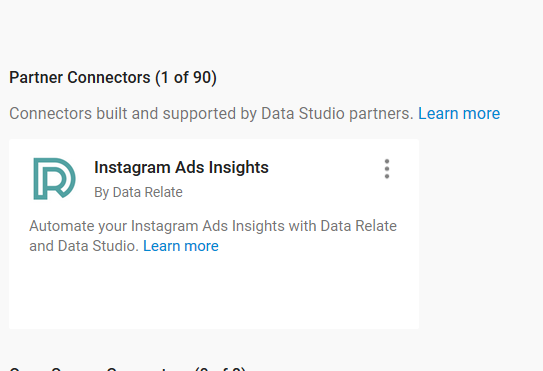
Step 5
You should then choose the Instagram Ads insights connector
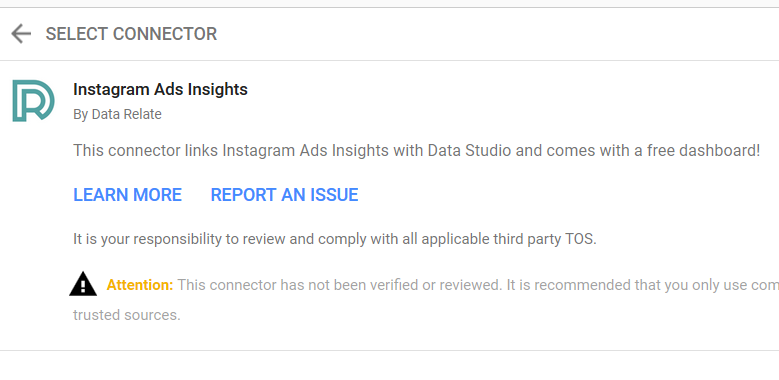
Step 6
Once selected, you can visit this page from the "Learn More" link or the contact page from the "Report and Issue" page
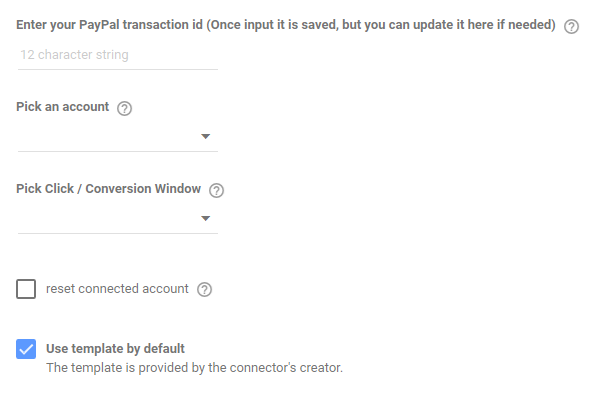
Step 7
Scroll down to find the settings for the app. You can get your PayPal ID from your account here. Pick the Facebook account you want to work with and the click/conversion window.
NB: The paypal will be associated with your Google email account. Only when logged in to this Google accoutn will you be able to sue the app.
Step 8
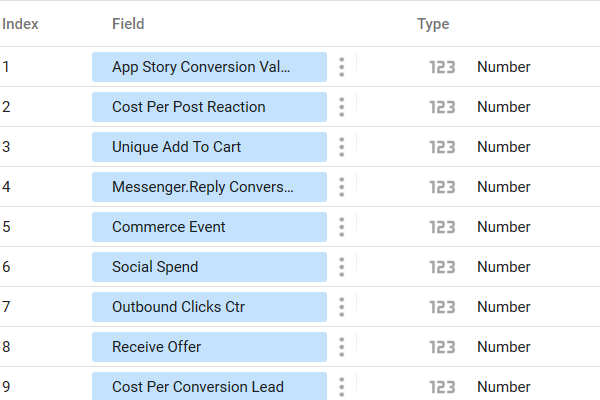
Once the configuration settings are selected you can see all metrics available with the connector
Step 9
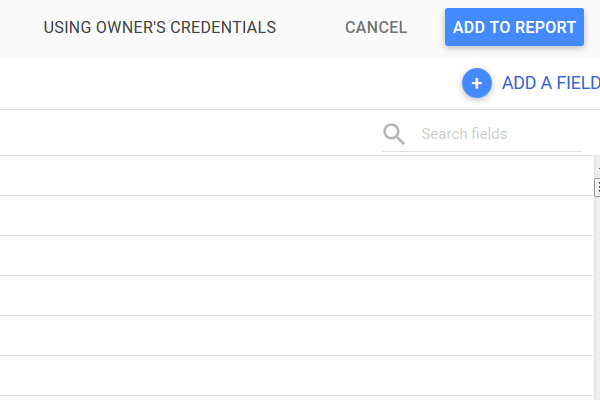
Then click the "Add to report" button in the top right corner. If you are install in the app for the first time, you will see be able to use our free template at this stage.
Step 10
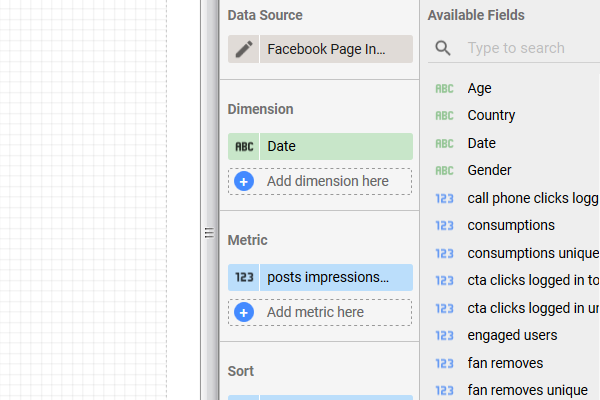
You will then see the new data source and available fields
Step 11
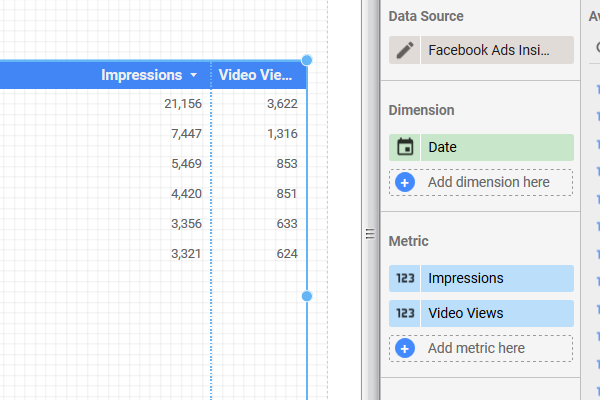
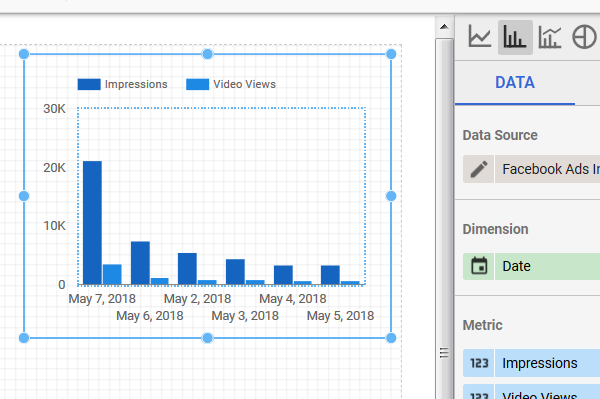
Click and drag on the dashbaord window and create your first graph powered by the new data source.
Step 12
Select a different type of graph and you can show your data in a different format.